


Network Observability
You Want To Fill The Visibility Gaps!
Record Everything Within Your IT…….. “By Listening To Your Network”
Listen To Your Network & Record Everything Happening Within Your IT
Before adding agents or synthetic traffic! Implement True Network Observability in three steps:
Achieving end-to-end visibility across complex environments comes with its challenges. However, you can systematically build complete network observability by breaking it down into actionable phases:
Phase 1: The Low-Hanging Fruit
Leverage Your Existing Data Sources Now
While full “correlation” requires the right toolset, this baseline metadata is already yours and it is waiting to be utilised.
[NetFlow/IPFIX]     -> Collect flow data from Layer 3 switches, routers, firewalls, and load balancers.
[Syslog Deployment] -> Utilize where NetFlow isn't native (VPNs, Wi-Fi controllers, Zscaler, AWS/Azure/GCP).
[Endpoint Metadata] -> Extract critical security telemetry from Microsoft Defender or CrowdStrike.
[Core Infra Data]   -> Tap into DNS and Active Directory (AD) metadata for identity mapping.
Phase 2: Filling Your Visibility Gaps
Eliminate Blind Spots Across Multi-Cloud and Hybrid Networks
Often, metadata alone isn’t enough. To achieve absolute certainty, you need to dig deeper! Consider the following if you have the budget:
[Packet Capture]    -> Access raw packets directly via switch SPAN ports or inline Network Taps.
[Packet Brokers]    -> Consolidate, aggregate, and filter traffic in complex environments.
[Cloud Flows]       -> Pull cloud flow logs directly from public and private cloud environments.
[CMDB Integration]  -> Map infrastructure data directly to actual business assets.
Phase 3: Receive, Process, Analyze & Utilize
Turning Raw Data into Actionable Intelligence
[RECEIVE]  -> Centralize the collection of packet-based data and metadata.
[PROCESS]  -> Funnel traffic sources into a scalable repository / high-capacity data lake.
[ANALYZE]  -> Deploy advanced analysis tools to correlate events and detect anomalies.
[UTILIZE]  -> Empower teams with high-fidelity intelligence. Get to know what you don't know.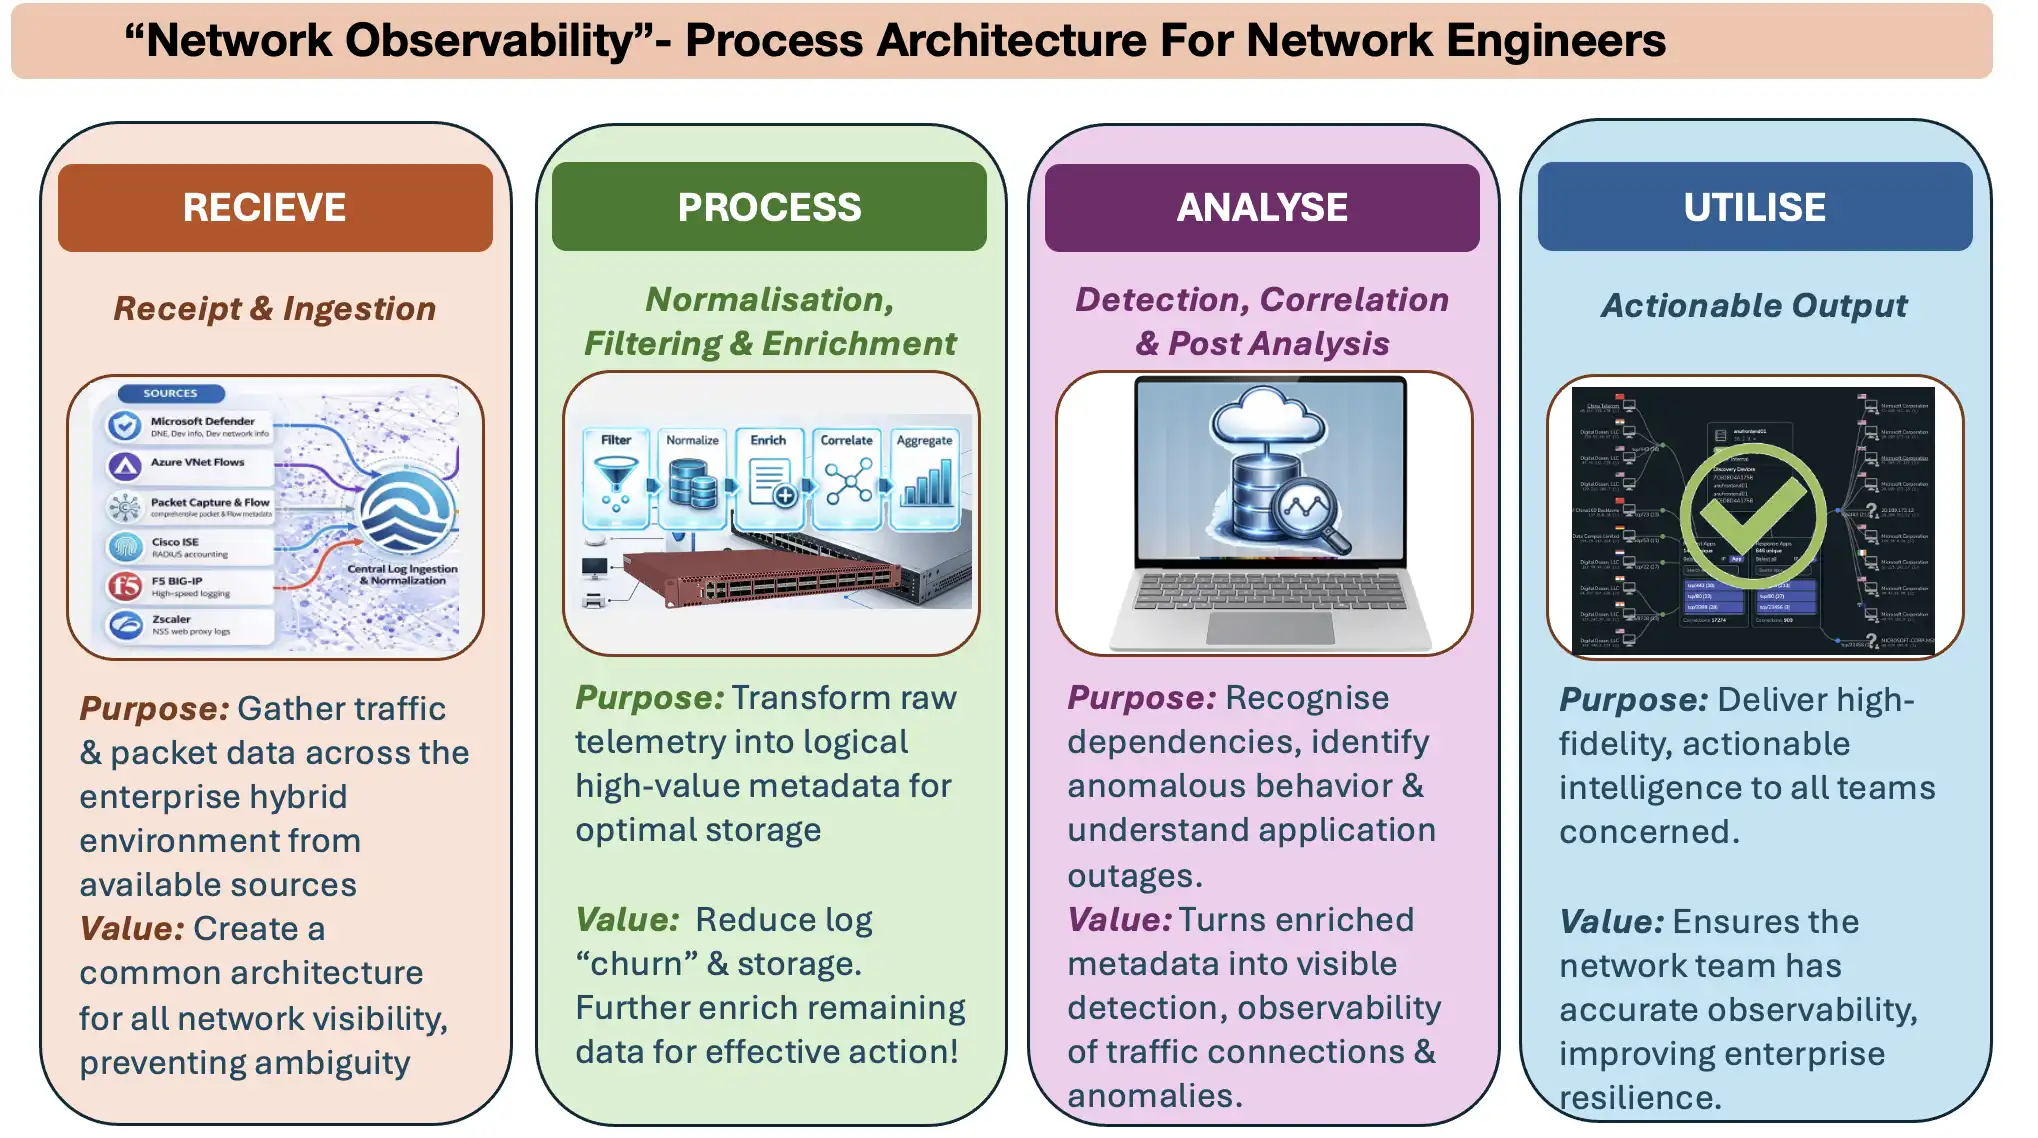
Reduce “COMPLEX IT” to “SIMPLE INTUITIVE GRAPHICS”


